🍓 Matplotlib中英文设置(二)
Matplotlib无法同时使用两种字体
壹丨合并两种字体1
第一步,下载并解压字体合并工具,放在桌面:C:\Users\MasterMao\Desktop\font_merge
第二步,复制字体到字体合并工具文件夹下。系统字体位于:C:\Windows\Fonts,搜索宋体、times就可找到对应字体,分别复制到:C:\Users\MasterMao\Desktop\font_merge
第三步,新建合并脚本:C:\Users\MasterMao\Desktop\font_merge\merge.bat。此处将合并后的新字体命名为sun-times.ttf
%~d0
cd "%~dp0"

.\otfccdump.exe --ignore-hints -o base.otd "C:\Users\MasterMao\Desktop\font_merge\simsun.ttc"
.\otfccdump.exe --ignore-hints -o ext.otd "C:\Users\MasterMao\Desktop\font_merge\times.ttf"
.\merge-otd.exe base.otd ext.otd

.\otfccbuild.exe -q -O3 -o sun-times.ttf base.otd
del base.otd ext.otd
pause
上述路径不可出现中文
第四步,运行merge.bat。安装新字体sum-times.ttf
叁丨新建绘图样式2
删除C:\Users\MasterMao\.matplotlib\fontlist-v330.json
新建绘图样式C:\Users\MasterMao\.matplotlib\stylelib\mastermao-sun_times.mplstyle
# Matplotlib style for scientific plotting
# This is the base style for "SciencePlots"
# see: https://github.com/garrettj403/SciencePlots

# Set default figure size
figure.figsize : 7.05, 2.35
figure.dpi : 600

# Set x axis
xtick.direction : in
xtick.major.size : 3
xtick.major.width : 0.5
xtick.minor.size : 1.5
xtick.minor.width : 0.5
xtick.minor.visible : True
xtick.top : True
xtick.labelsize : medium

# Set y axis
ytick.direction : in
ytick.major.size : 3
ytick.major.width : 0.5
ytick.minor.size : 1.5
ytick.minor.width : 0.5
ytick.minor.visible : True
ytick.right : True
ytick.labelsize : medium

axes.unicode_minus : False

# Set line widths
axes.linewidth : 0.5
grid.linewidth : 0.5
lines.linewidth : 1.
lines.markersize : 4.0

# Set line style as well for black and white graphs
axes.prop_cycle : (cycler('color', ['k', 'r', 'b', 'g']) + cycler('ls', ['-', '--', ':', '-.']))
#axes.prop_cycle : cycler('color', ['023047', 'FB8500', '219EBC', 'FFB703','8ECAE6','2A9D8F','F4A261'])

# save config
savefig.bbox : tight
savefig.format : webp
savefig.dpi : 600
savefig.pad_inches : 0.05

# Grid lines
axes.grid : True
axes.axisbelow : True
grid.linestyle : --
grid.color : k
grid.alpha : 0.2

# Legend
legend.frameon : True
legend.framealpha : 1.0
legend.fancybox : True
legend.numpoints : 1
axes.labelsize : 7
legend.fontsize : 7

# Use serif fonts
font.size : 7
font.serif : Times New Roman + SimSun
font.family : serif

# Use LaTeX for math formatting
text.usetex : False
这里注意font.serif对应的合成字体的具体名,可以在word里面查看系统安装的字体名
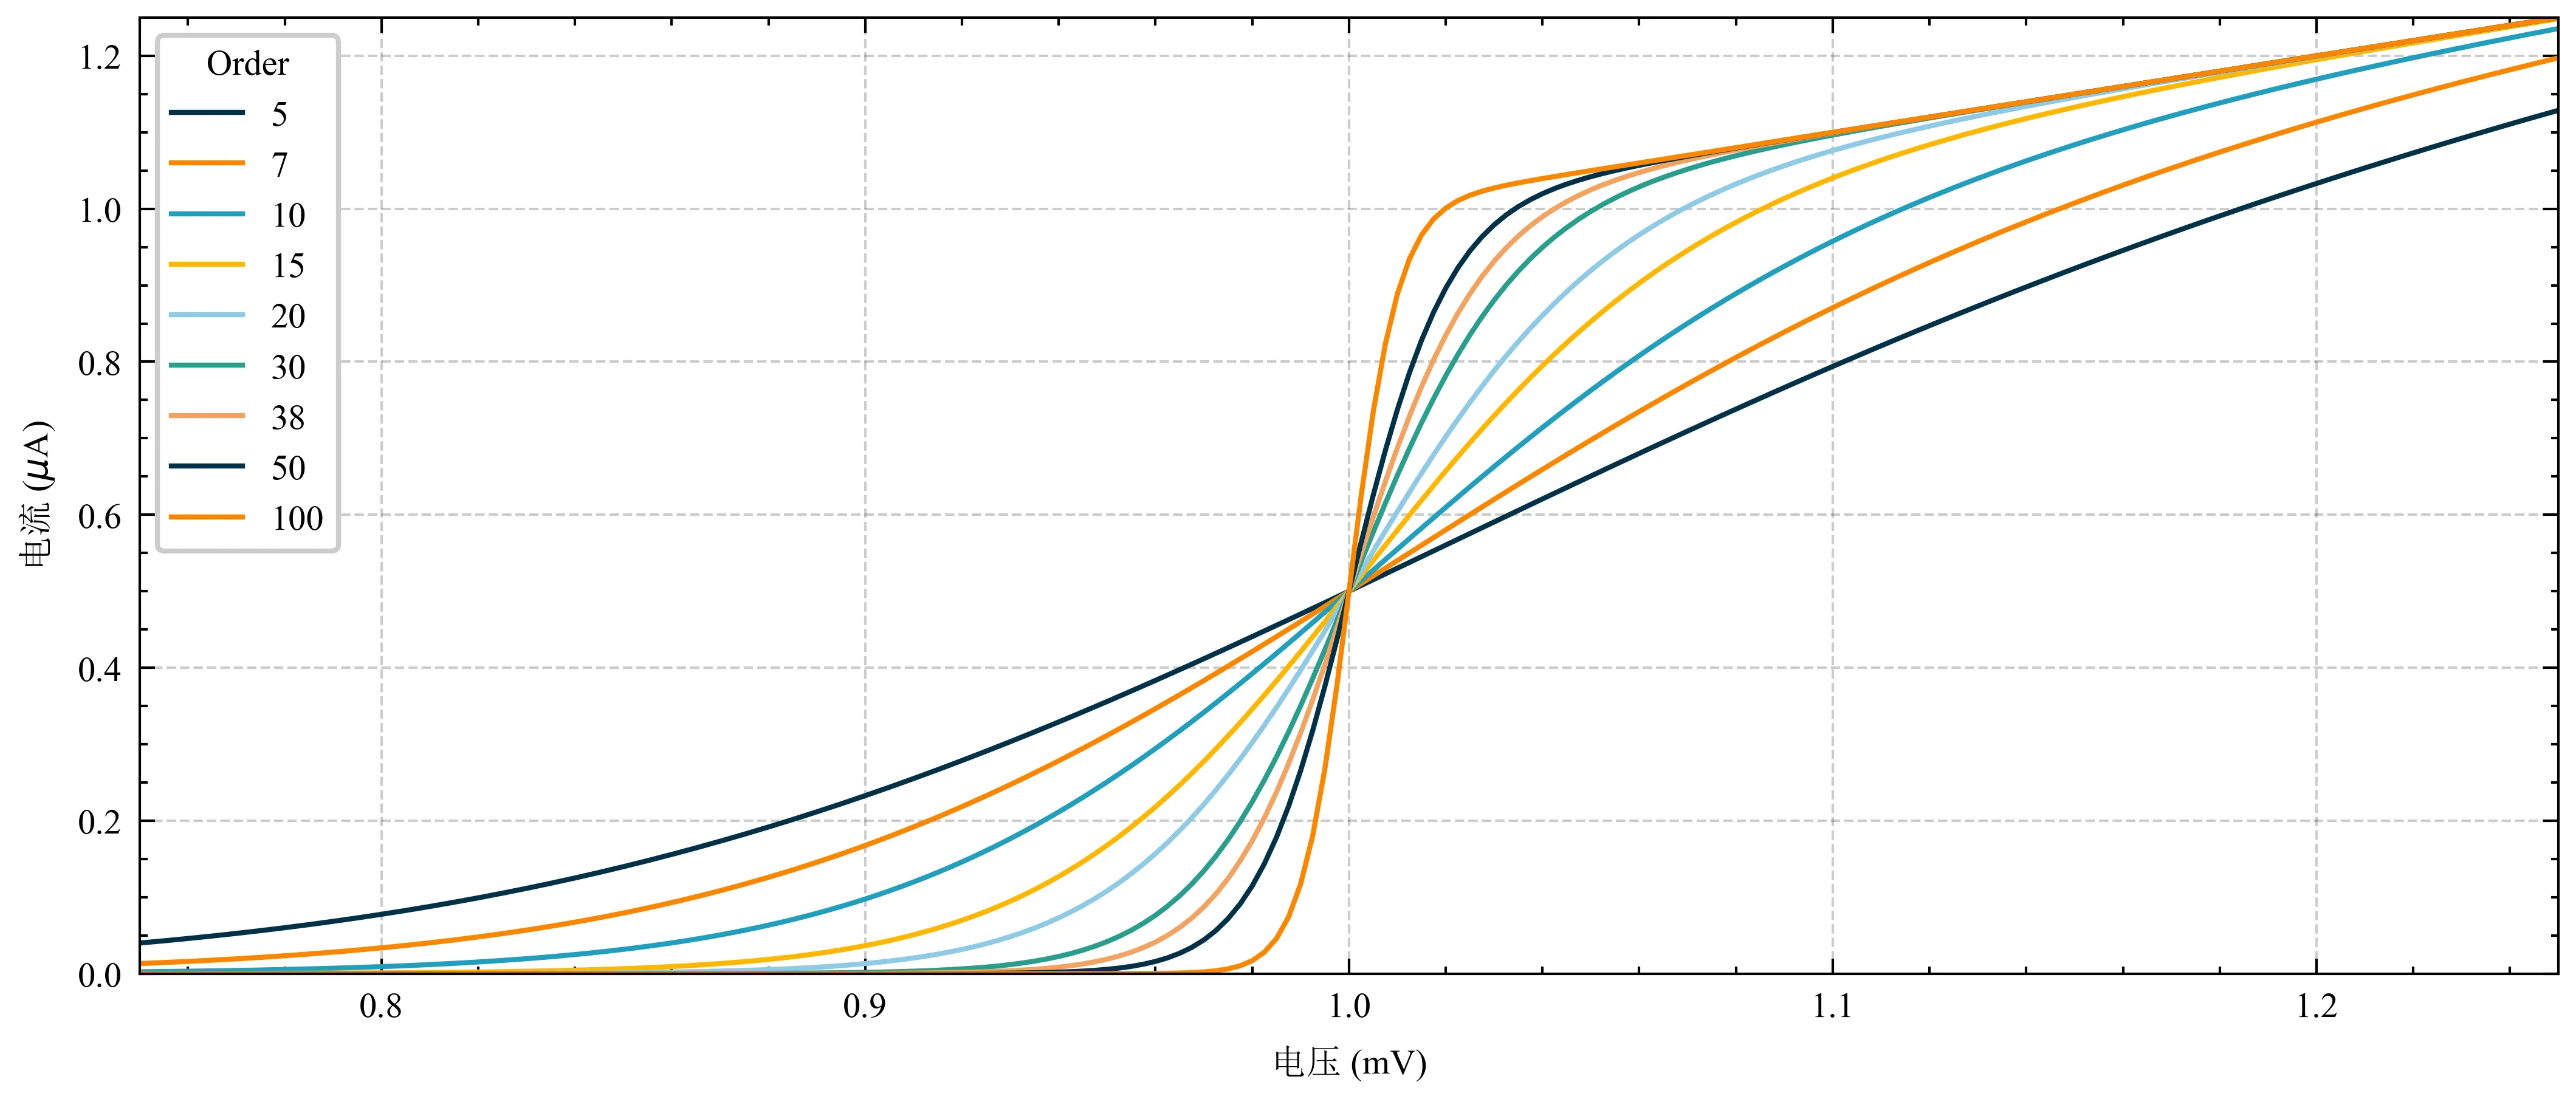
肆丨绘图查看效果
import matplotlib.pyplot as plt
import numpy as np

plt.style.use('mastermao-sun_times')


def model(x, p):
    return x ** (2 * p + 1) / (1 + x ** (2 * p))


if __name__ == '__main__':
    x = np.linspace(0.75, 1.25, 201)

    fig, ax = plt.subplots()
    for p in [5, 7, 10, 15, 20, 30, 38, 50, 100]:
        ax.plot(x, model(x, p), label=p)
    ax.legend(title='Order', fontsize=7)
    ax.set(xlabel=r'电压 (mV)')
    ax.set(ylabel=r'电流 ($\mu$A)')
    ax.autoscale(tight=True)
    fig.savefig('./fig.webp')
-
知乎,@木土木,完美解决Python的matplotlib库中英文字体混显问题 ↩
-
MasterMao's Blog,@一一风和橘,毕业论文Matplotlib绘图中英文设置(一) ↩